Години искуство
Задоволни клиенти
Изработени врати
Успешни проекти
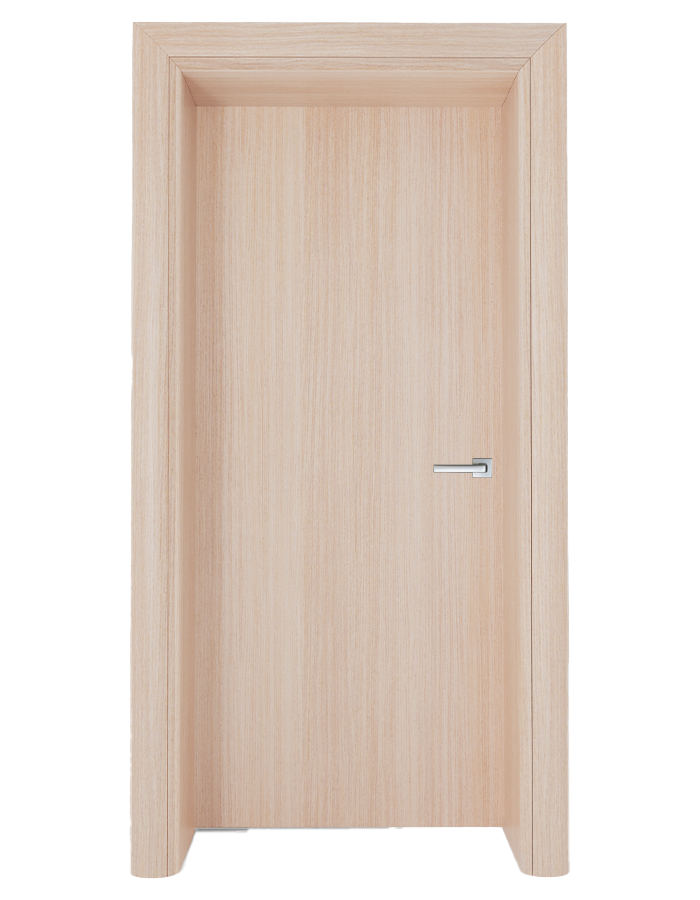

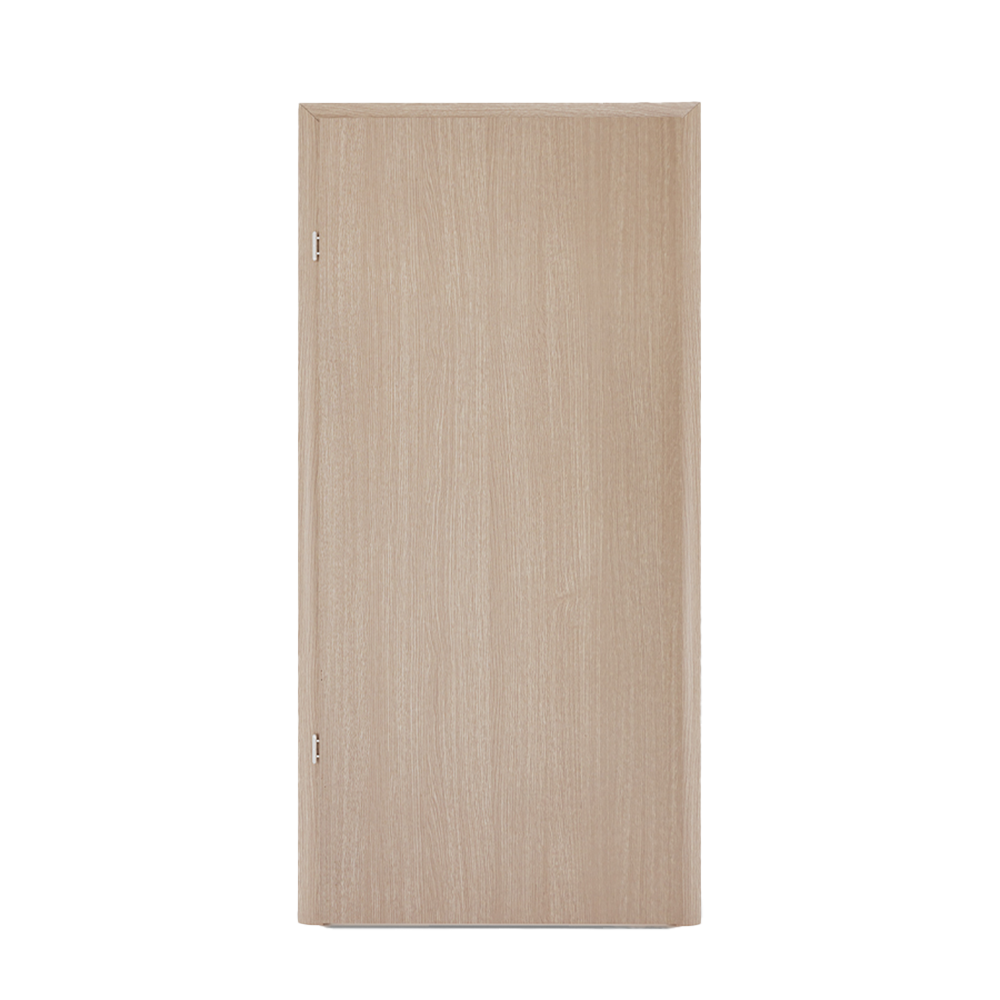
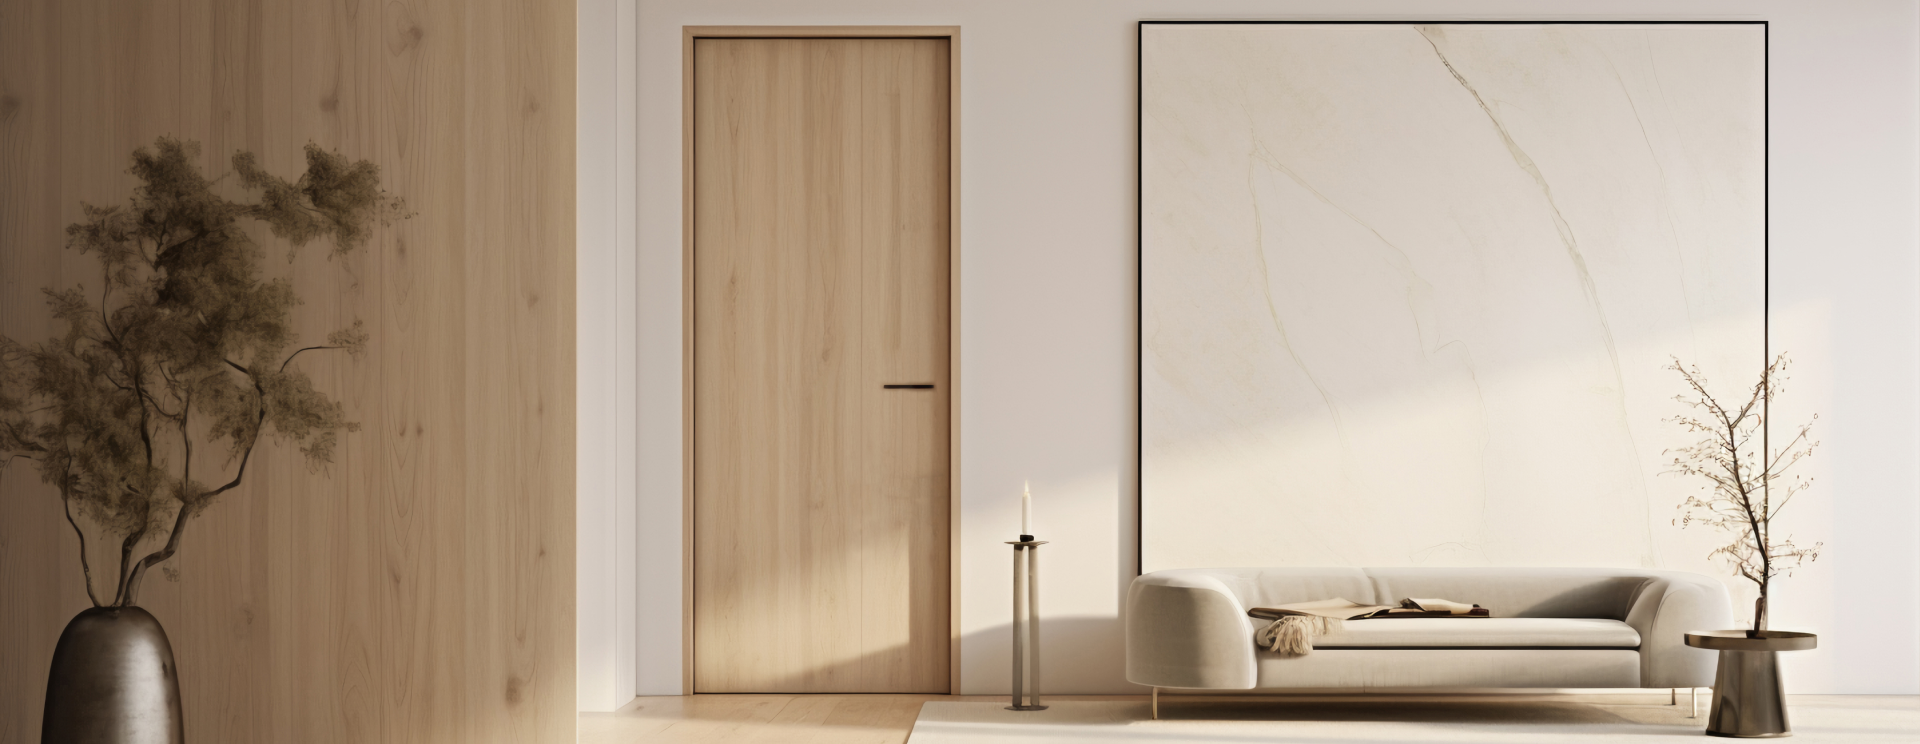
Откријте ја совршената врата за вашиот дом или деловен простор. Нашиот каталог нуди богат избор на стилови, бои и материјали кои одговараат на вашите потреби и вкус. Дизајнирајте ја вратата што ќе остави впечаток!